
Program Flow & Design

Credit: Midjourney
The program is conducted as an in-house training program for organisations looking to develop their teams. The program includes 6 hours of face-to-face contact (including breaks) and two subsequent follow-up sessions remotely.
We will travel to deliver this training to your doorstep.
Despite the advances in technology, helping eager participants learn and the ability to assist them when they stumble is difficult remotely, when often their challenges are specific just to them.
Those wanting to attend remotely still can, however, the experience will not be the same.
The subsequent follow-up and embedding session is conducted remotely at least 4 weeks post the face-to-face training.
The program is broken into 3 stages:
Foundations and context setting.
Tech and skills content (Financial modelling with Excel followed by Data Analytics with Power BI).
Debrief and ongoing learning.

So what?
What are the benefits?
Credit: Midjourney
Decision-making skills can be complex especially when deciding which skill and tool to apply for any given decision. Excel can be limiting and Power BI can be overkill. Financial modelling can be too high level and Data Analytics too complex to apply. This course will empower participants to navigate this complex process of which skill and tool to apply when.
There are very few courses in the market that both Financial Modelling and Data Analytics in a practical way that will enable participants to start their digital journey.
The benefits will allow those to kick start this exciting discovery and also be able to implement some of the learnings from the course directly in their roles or into the key business decisions they support.
Decisions can then be made based on robust data and well-crafted models. Advisory and consulting are underpinned by enabling business users to make better decisions and this is a primary focus of the program.
Finance business partners looking to sharpen their advisory and consulting skills will be well-equipped to tackle some of the most complex problems by applying the learnings from this course.
Stage One – foundations and context setting

Credit: Midjourney
Building any form of skills is critical with solid foundations. We have to ensure that concepts and frameworks are well-embedded and understood from the start.
If you try to build anything solid on the beach with sand, it doesn’t take long for the tides to come and wash it away.
We ensure that a solid knowledge of data, financial modelling concepts and terminologies and language is made clear upfront. We close gaps through the use of live polls that the participants are involved in.
Stage Two – Tech and Skills content

Credit: Midjourney
Once the foundations are laid down firmly, it’s then possible to build on those foundations with some hands-on practical skills.
Participants in the training will be provided with the necessary assumptions and data with which they will be building both their 3-way financial models as well as the star schema data models.
There is no other training available that covers both of these topics which are related but different in many aspects.
Financial modelling with Excel
We will start by building a financial model based on a set of key assumptions.
These assumptions can be tailored somewhat to suit your chosen industry, but fundamentally they are sales and cost of sales, operating costs including labour and other indirect costs. There are elements of capital expenditure and funding to deal with as well.
The training will also cover the use of a scenario manager and how you integrate scenarios into a working model to make it easy to compare these results side by side.
In addition to having hands-on practice, participants will be provided with solutions and manuals so that they can complete the rest of the model in their own time so that they can embed the skill.
Other additional example models and workbooks will be shared including the ones below.
Data Analytics with Power BI
Shortly after the Financial Modelling work, participants will jump into building their first data model using Power BI and a commonly known process called ETL (Extract, Transform and Load).
With Power BI being freely accessible to anyone through their desktop app, there really isn’t any reason not to explore this amazing tool.
Through this process, they will take raw data from an accounting system and transform this into facts and dimensions and create a star schema relationship between these tables.
This process will include the creation of a finance-specific dates table to handle multiple contexts ie budgets and actuals data. They will create this table with the introduction of M Script which enables them to get familiar with the backend customisation that is possible in Power Query.
They will then be introduced to the very powerful and important formula language in data analysis expressions (DAX) which will enable them to create some basic measures upon which calculations can be produced.
Finally, once that is all sorted, they will start to build their report and visualisations on their canvas. Most important is their ability to create interactive and insightful visuals that enable either exploratory investigations by users or explanatory insights on the story they are trying to convey.
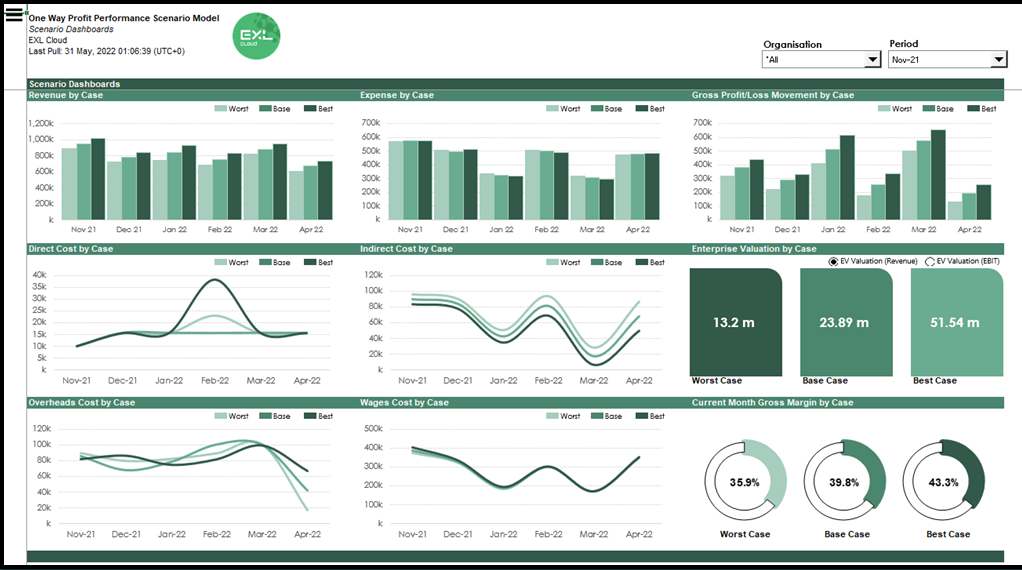
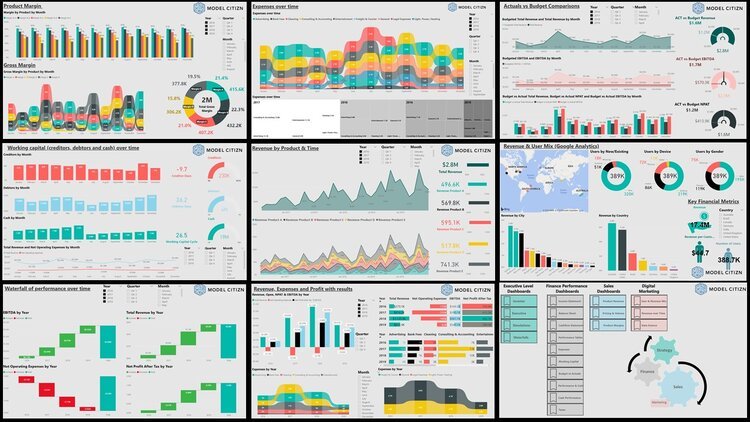
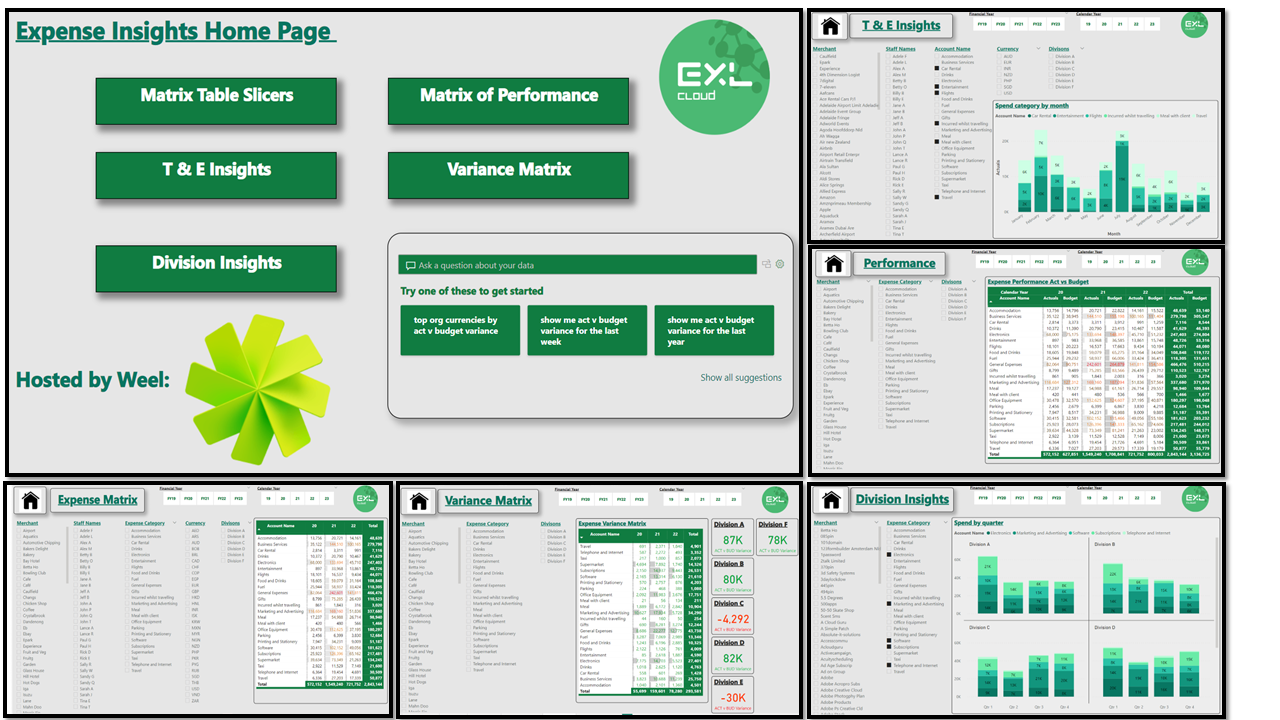
They will also be given access to explore other advanced Power BI reports and explore the extended functionality that is largely untapped in the custom visuals which will allow them to rapidly develop scenarios and models in a fraction of the time without the complexity.
We will also explore the Artificial Intelligence that has already been built into Power BI whilst exploring ways to use it in the development process.
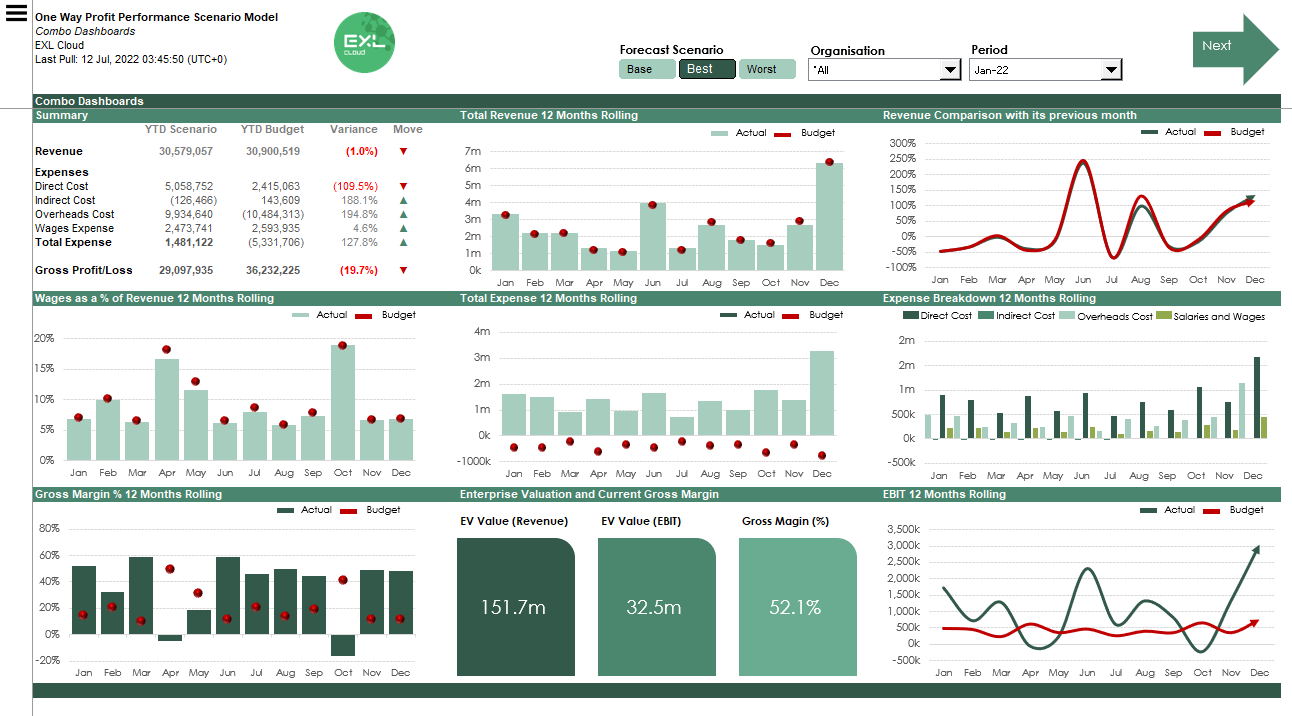
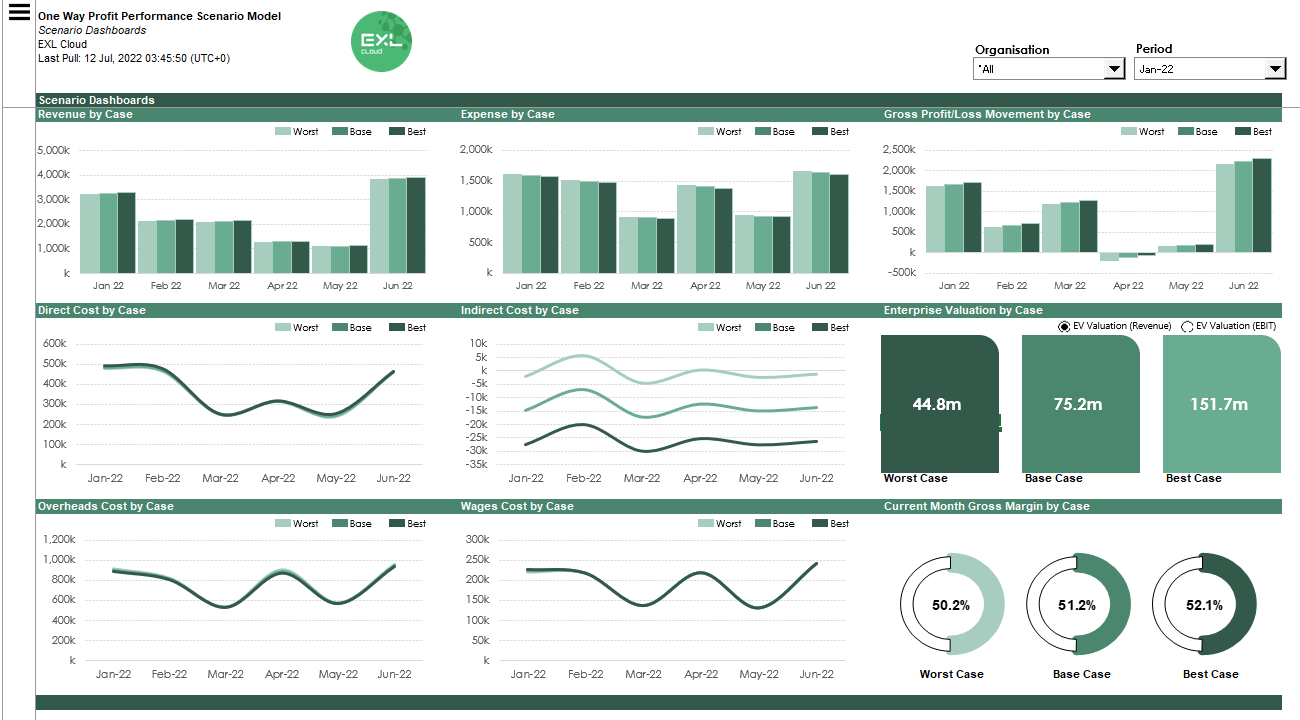
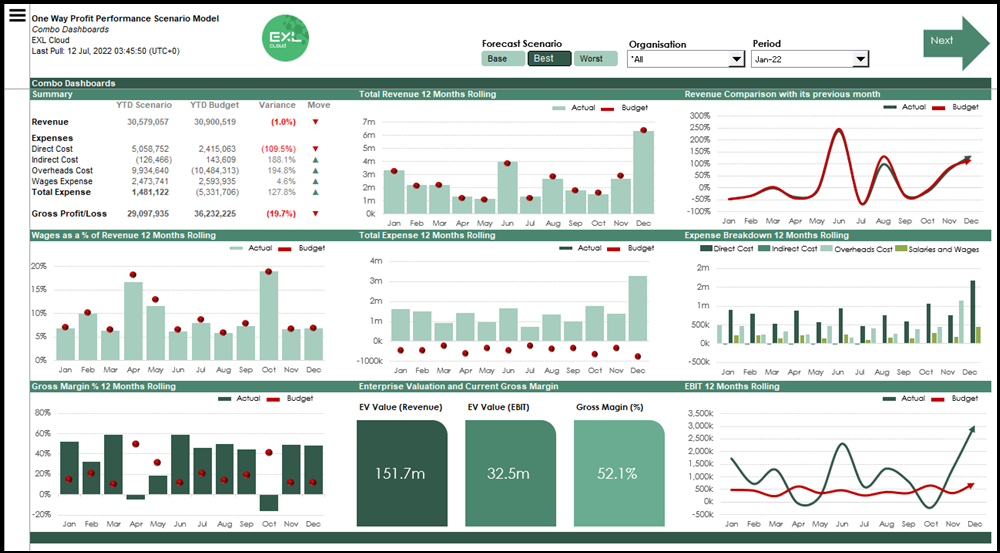
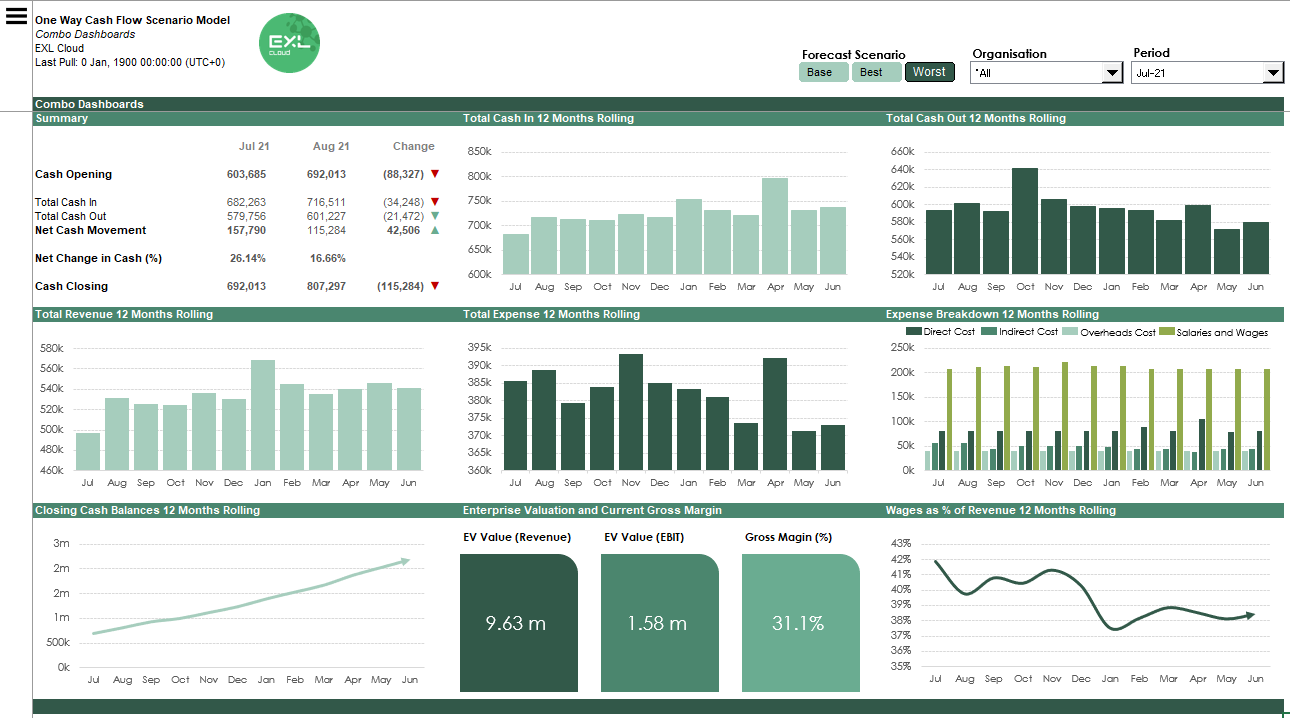
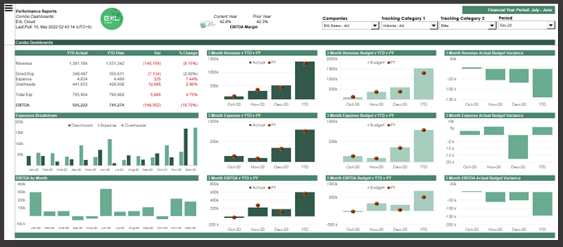
Below is an example of one of these more advanced Power BI reports which can be used to further inspire participants to go beyond their current skills that are still developing.
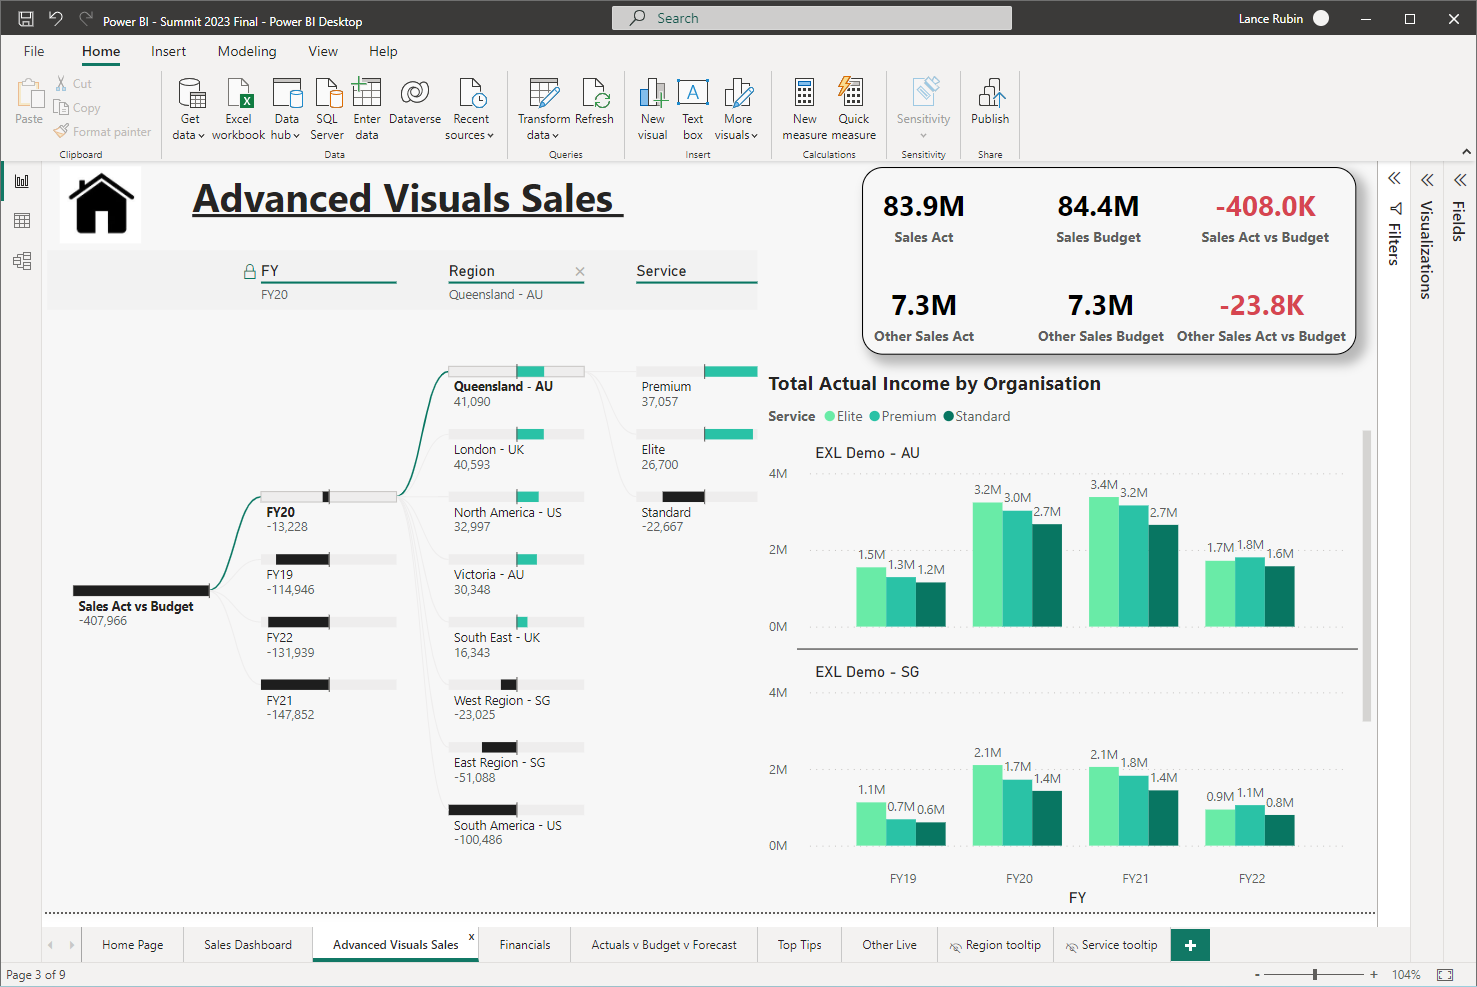
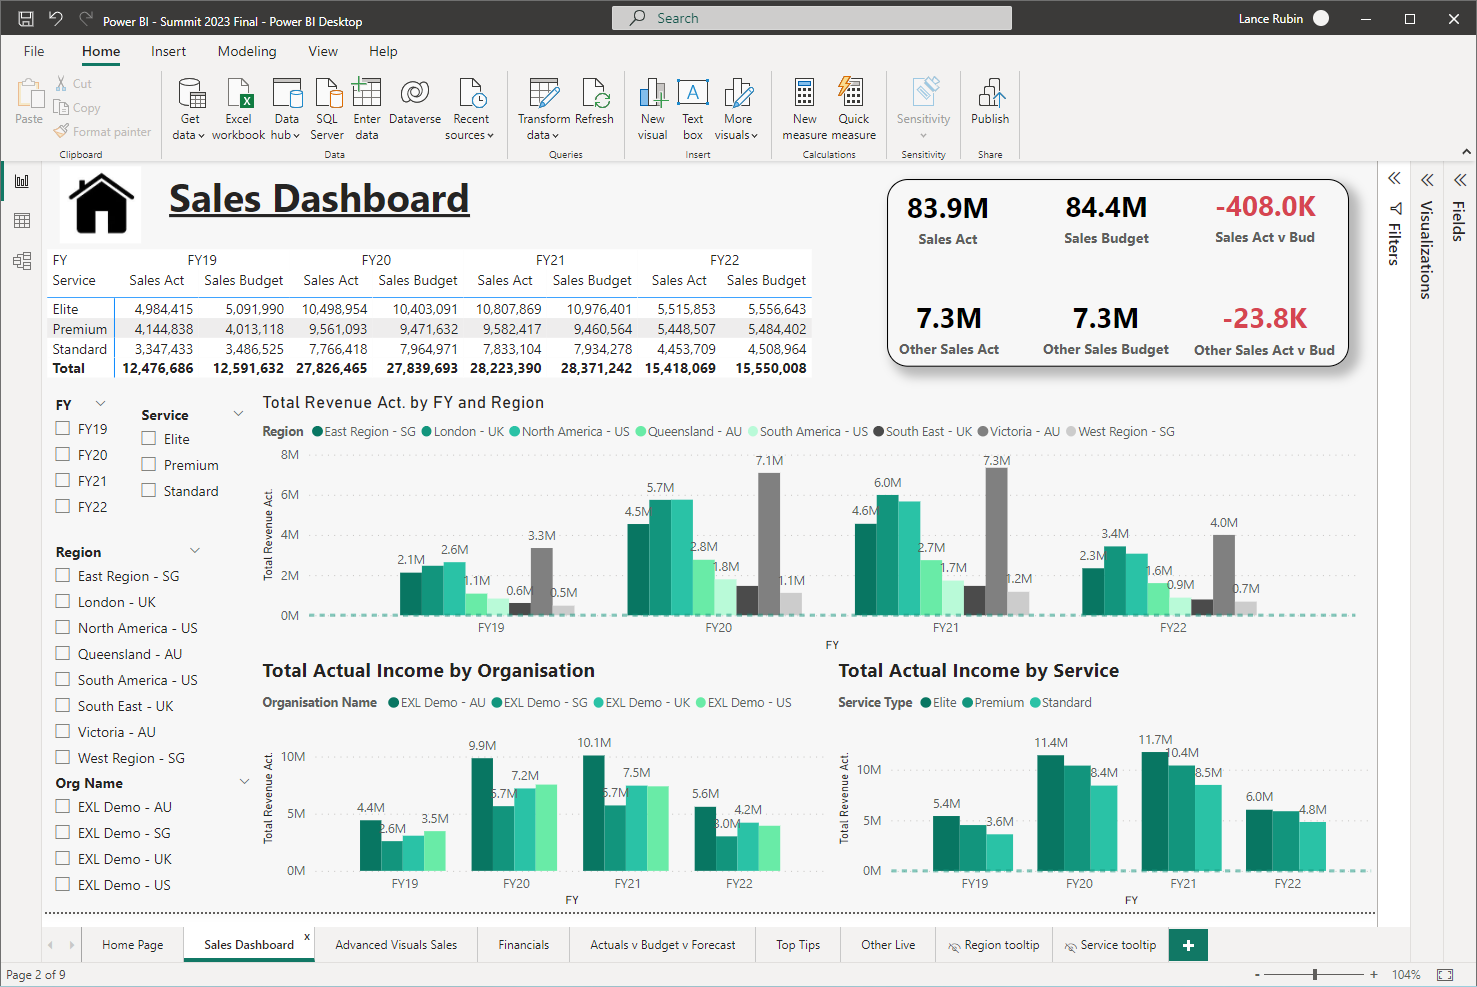
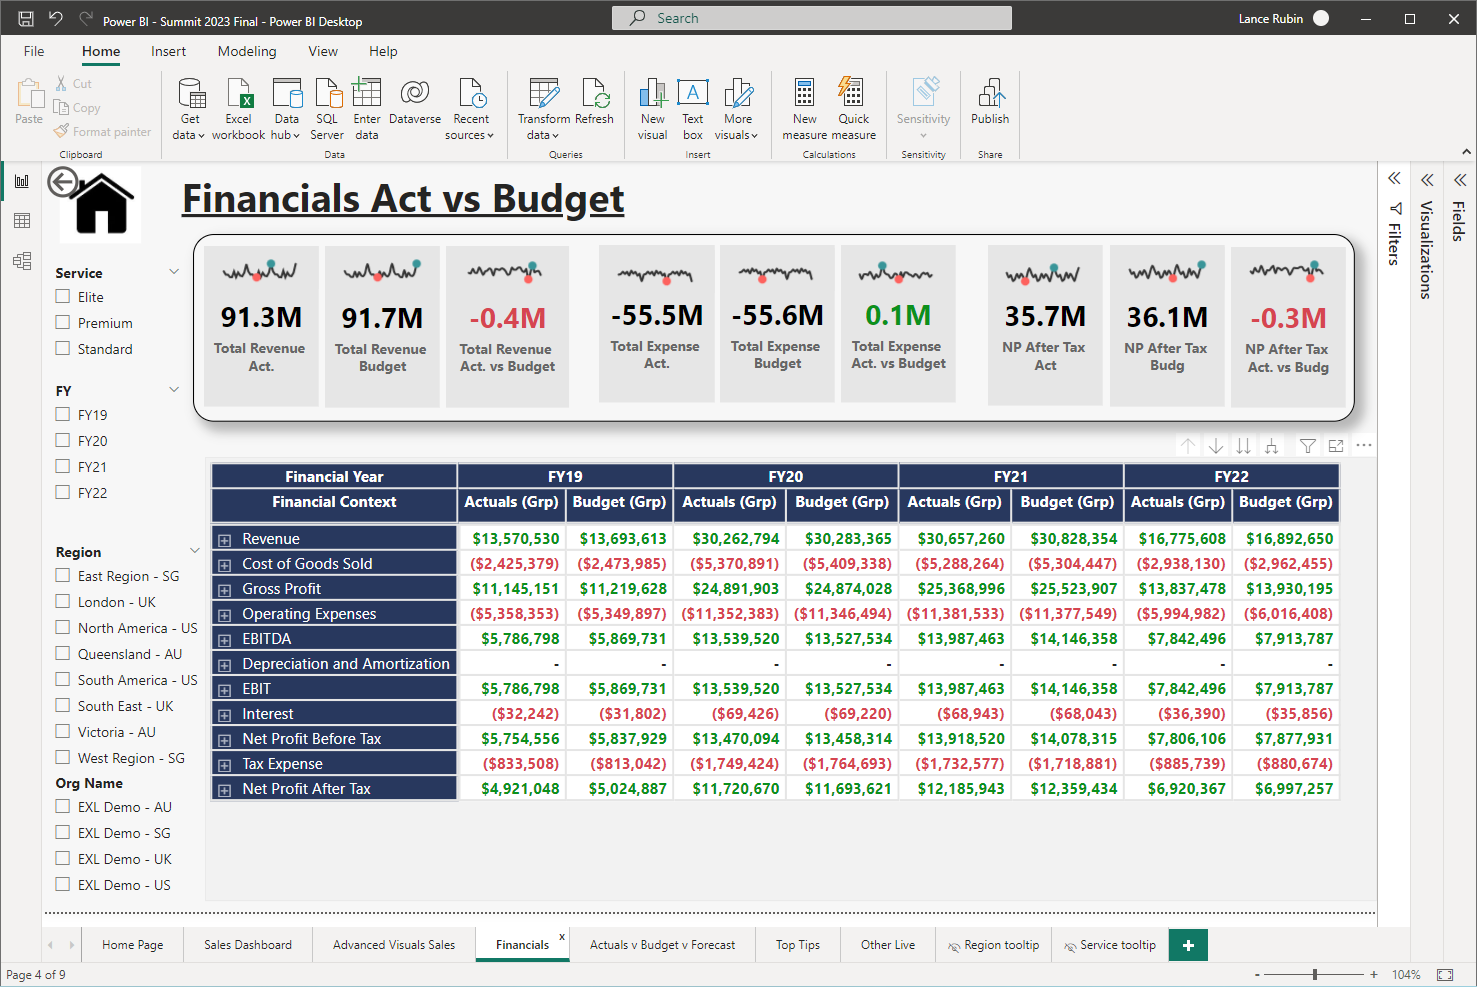
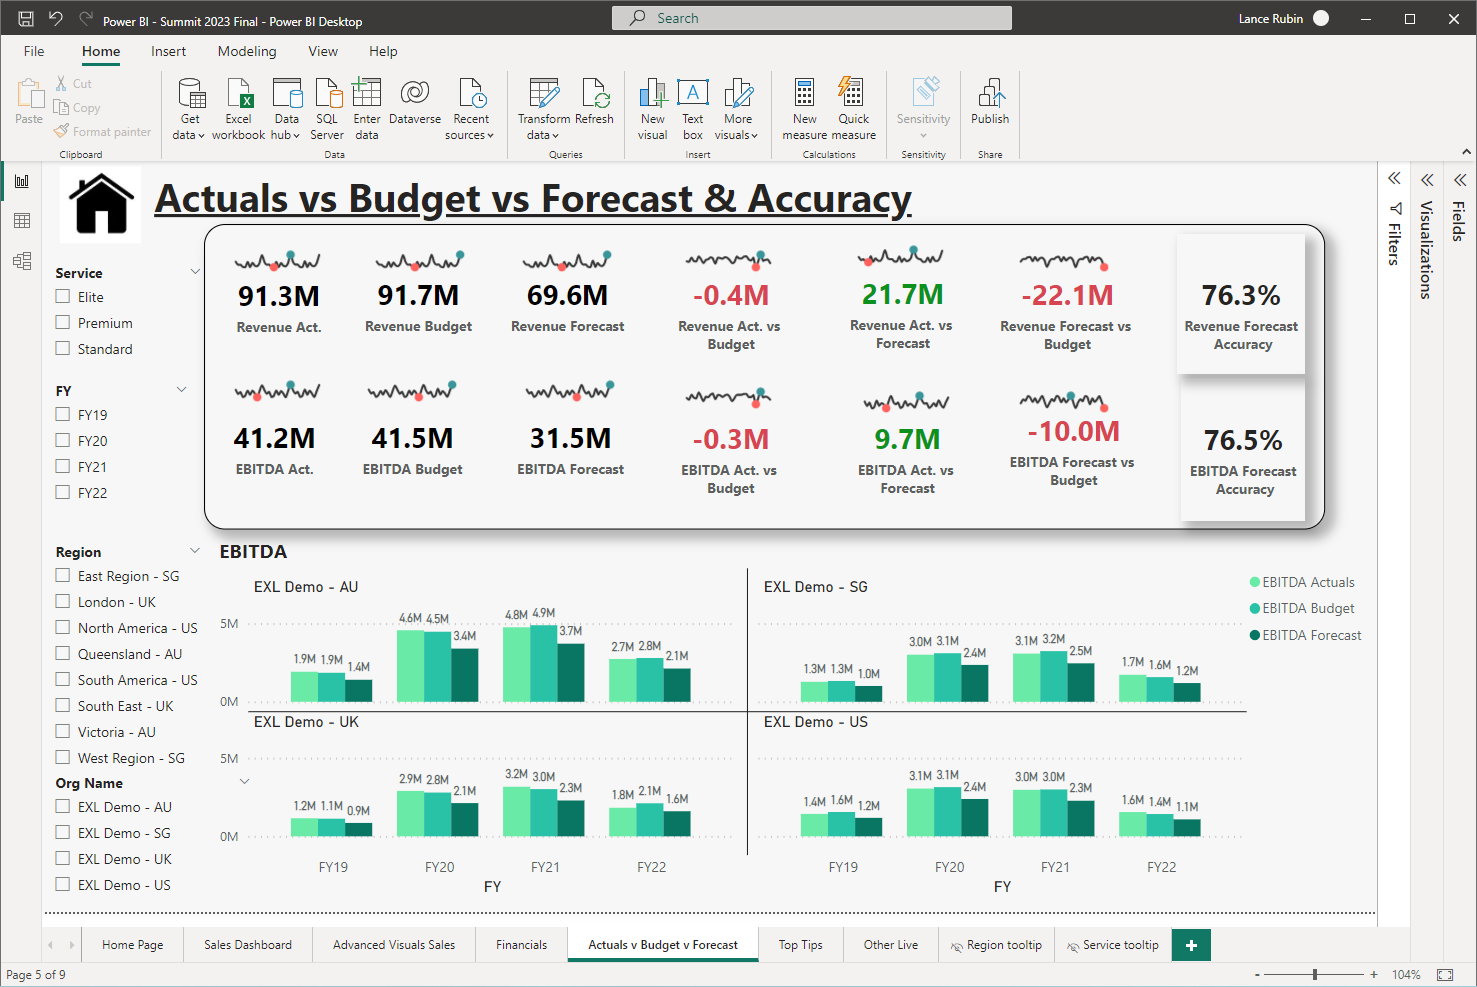
As part of the training technical content, we will provide participants with access to the embedded Power BI model below, which was presented at the recent Power BI Global Summit.
The Power BI model has been embedded here for you to experience for yourself this revolutionary data analytics tool.
Stage Three – Debrief and Ongoing Learning

Credit: Midjourney
Learning should never end after gaining a few new technical skills.
It’s a constant loop of developing and enhancing one’s skills.
The training program is merely the start of the journey, but ongoing work is required to keep up to date with the latest innovations and developments.
At least 4 weeks post the face-to-face training there will be two remote check-in sessions with all the participants to see how they have been able to embed some of this knowledge into their work.
This will be their opportunity to ask any further clarifying questions or help in areas they perhaps got stuck.
If additional support or ongoing training is required, this can also be discussed at this time.

Credit: Midjourney
What to bring to training?
All participants will need fully charged laptops with the latest Microsoft Excel and Power BI installed. Power BI is a free download from the Microsoft website.
Please note: Apple Mac computers are not supported for this program. Anyone that wants to bring a Mac is welcome to, but we cannot provide any support or guidance unless you are running Boot Camp or Parallels ie a Window operating system.
Stay connected post the program for ongoing tech updates as they unfold, and it’s moving fast!