Introduction to the co-author
David Benaim has been a Microsoft MVP in Excel since 2020. He has an active YouTube channel, and regularly blogs and gives webinars about Excel, Google Sheets and other workplace technologies such as PowerPoint, Zoom, Teams, Power BI and more. David was also the guest battler in the Financial Modelling in Excel meetup, Google Sheets vs Excel with Alan Murray. Links are included below.
Why did David select the topic and why is he passionate about it
Most dismiss Google Sheets as inferior to Excel Desktop in all aspects besides collaboration but this could not be further from the truth. For years, David has chosen to implement certain spreadsheet solutions in Sheets over and above Excel for a variety of reasons. Whilst Excel has benefits, there are areas that Google Sheets is stronger at. Auto-refreshing Pivots, autocomplete validation lists, text cleanup tools and an array of additional functions (pun intended).
We will just touch on certain issues in the text but the videos from David’s YouTube have more in-depth information, make yourself a free copy of the file used in this article here, and note that the newest Google Sheets is compared to Excel Desktop’s Microsoft 365 version.
Topic and context in no more than 3 sentences
It’s just not possible to summarise this in 3 sentences. There are many aspects to a spreadsheet tool, including formulas, data entry, analysis, ease of use, compatibility and more. This article compares the tools under several sub-headings listed below.
1. Optimal data entry
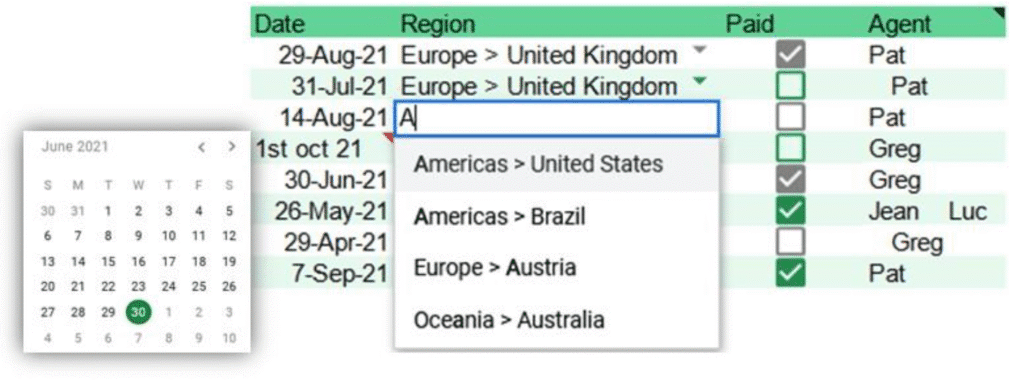
En-masse data entry is much more streamlined in Google Sheets which allows checkboxes, date pickers (just by applying date validation to cells), and my hands down favourite – autocompleting dropdowns, the latter dismisses the need for complex dependent dropdowns as you can set up lists in a hierarchy in one cell. You also will get a sidebar with validated cells. Access all through the edit menu or see this video for more information.
Google’s Sheet protection can be either done by the user (based on sign-in) or as a pop-up warning upon editing of any cell. It cannot be limited to certain commands though so there is no way to get around it for small adjustments such as filtering. Excel’s equivalent is turned off or on for everyone at once but it has more granular options in terms of which commands can be accessed (although I often still run into things that I expect to be allowed but are not). Personally, I find both of them to be slightly inferior to what I would like but I find myself setting up Google’s “Show a warning” most frequently. Excel’s Data validation can be found on the Data tab and works quite well but is more limited in its capabilities.
Where Excel easily shines though is its Table feature, this rarely used command on the Insert tab (or Home > Format as Table) has plenty of benefits for formulas, table-wide formatting, auto-expansion and speeding up calculations as can be seen here.
Sheets’ equivalent is the inferior “Alternating colours” under Format which has only the table-wide format speed-up aspects. Conditional formatting and macro recording capabilities are more or less equivalent in both applications albeit with different user interfaces.
2. Functions
91% of functions that exist in both, the rest are unique. Total functions are similar, even though Google wins by 2.
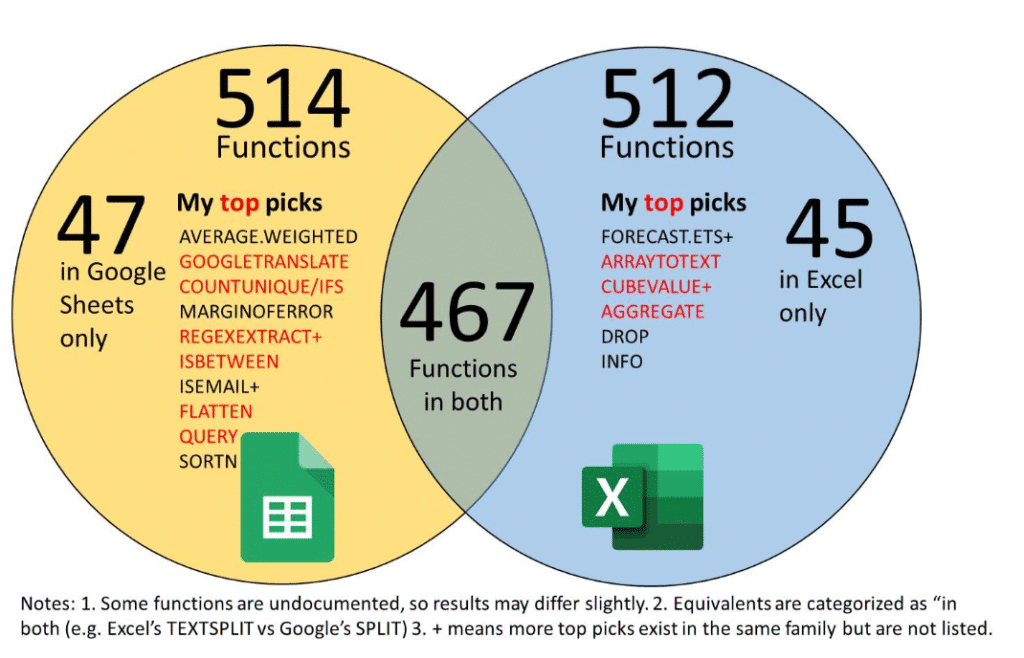
When it comes to functions in one but not the other, each has good ones but Google has more that I wish were in Excel than vice versa (my top picks are shown in the diagram below). Certain functions differ across apps slightly though, such as Excel’s CELL function has more capabilities whilst Google’s SPARKLINE offers more flexibility by being a function compared to command on Excel’s Insert tab.
Google offers Smart fill, a version of Excel’s Flash Fill that detects fewer patterns but can write the formula for the user. This and suggested formulas are being introduced in Excel Online at the time of writing but not in Desktop quite yet. Google’s approach to named functions is far simpler to use, Data > Named functions (as shown here) allow you to build them through a user interface rather than a complex LAMBDA formula in Excel, you can also import named functions from other workbooks.
3. Dynamic array functions
Google has had Dynamic Array functions well ahead of Excel. Google also adds several to the mix shown here such as =FLATTEN (which unpivots data) or =SORTN (which provides top N), which are only achievable in Excel by combining some together (similar to COUNTUNIQUE/COUNTUNIQUEIFS which are native in Sheets). Google’s SORT and FILTER functions are more powerful than Excel’s, whilst SPLIT and GOOGLEFINANCE are Google’s more powerful equivalents of Excel’s TEXTSPLIT and STOCKHISTORY, other than that, Google recently added mostly the same dynamic array functions (such as WRAPCOLS, VSTACK, CHOOSECOLS etc.). You cannot click a cell in another Google Sheets workbook to reference it but they use a more robust (yet slightly more complex) method with the IMPORTRANGE function.
A few differences exist in arrays conceptually though. In Google, you need to wrap a formula inside ARRAYFORMULA() to make it capable of handling arrays (=ARRAYFORMULA(A1:A4*B1:B4) which you don’t for Excel and using # notation is an Excel-only feature (e.g., where =C4# refers to the array starting in cell C4). Conversely though, you can stack Google Sheets tables over each other using the notation ={B4:E20;B28:E40}, equivalent to Excel’s recently introduced VSTACK. Excel’s dynamic arrays are definitely worth understanding, explained in this video.

4. Analysis
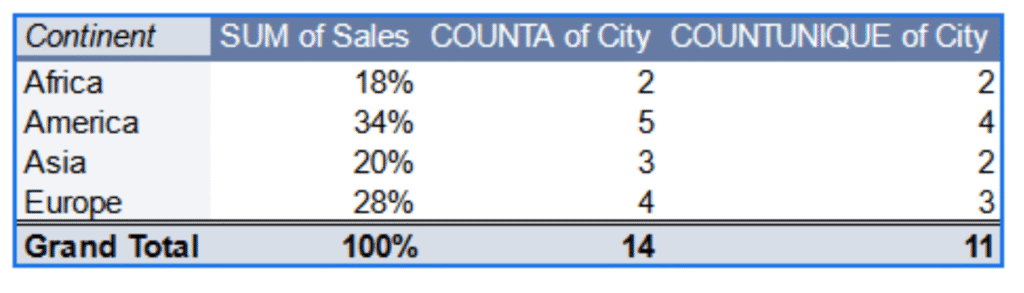
Google Sheets’ PivotTables have new aggregations COUNTUNIQUE and MEDIAN and refresh automatically, but it’s slicers are less powerful. Sheets also has “Column Stats” in the data menu which can give you comparison statistics for you in seconds, both are shown here.
Excel also has PowerPivot which gives you an entirely new coding language for creating measures and allows for building table relationships and Google’s Explore (bottom right) is similar to Excel’s Analyze data. Google’s charts have fewer customisation options, but it does give you the option to aggregate values in a column/bar chart without using a PivotTable which can be achieved in Excel through the underutilized Pareto chart.
5. Keyboard shortcuts
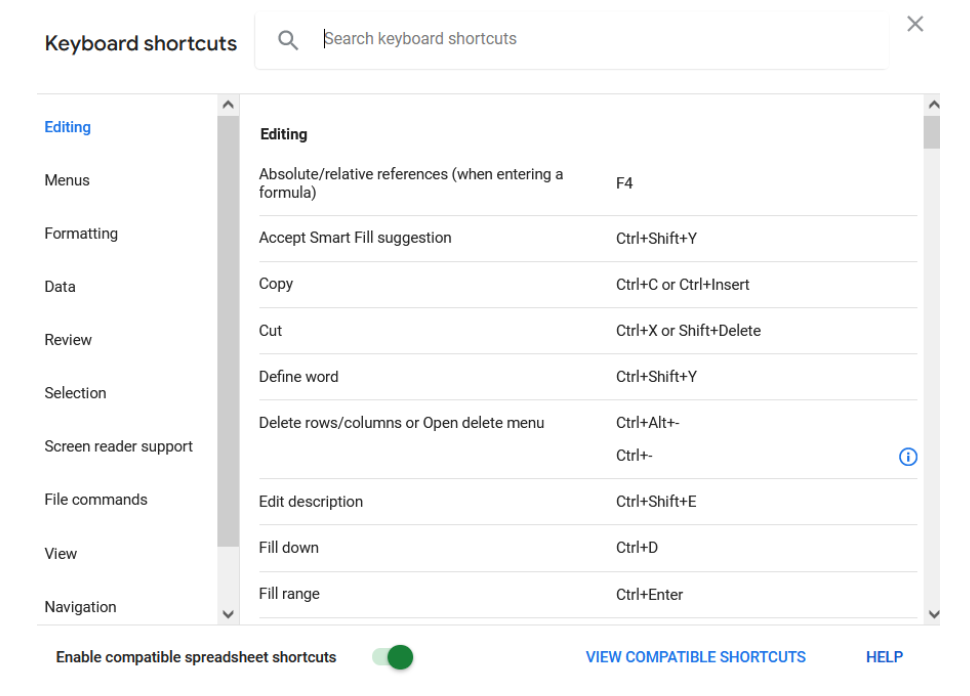
Who doesn’t like their shortcuts? The good news is that almost all keyboard shortcuts are identical in both, however, in Google Sheets, you will need to override your browser shortcuts by clicking Help > Keyboard shortcuts > Enable compatible spreadsheet shortcuts.
Excel’s Auto sum shortcut (Alt =) and filter shortcuts (Ctrl Shift L) and filter menu navigation don’t exist in Google. Sheets has Paste shortcuts with Ctrl Alt V to paste formats and Ctrl Shift V to paste values and Ctrl \ to clear all formats. There are small exceptions where they differ (usually due to browser shortcuts that cannot be overridden), the only notable one for me is to go to the next worksheet, it is Ctrl Pg Down in Excel whilst in Sheets it’s Alt down arrow. Frustratingly though, the Alt + key (accelerator) shortcuts do not work in Google Sheets, but personally, I never use those. There is also no quick access toolbar in Google Sheets which is key to my productivity in Excel.
6. Querying data
Google’s QUERY function is the most powerful function inside any spreadsheet at the time of writing. Users can type SQL-like code inside it to transform the data, filter, sort, group by, and reorder columns for example. Google has a remove whitespace option missing in Google and although both offer similar tools to remove duplicates, Google doesn’t have a built-in “highlight duplicates” command within conditional formats.
Whilst Google has the most powerful function, its capabilities don’t come close to Excel’s Power Query, which is the biggest change to have happened to the spreadsheet in 25+ years, it offers a revolutionary way to reshape and transform data in a refreshable way as well as options to grab data from other files, pdfs, websites, or a folder of files. It’s a little hidden under the Data tab (Get Data) and still heavily underutilised in the spreadsheet world, despite its existence for over a decade. Once again, similar to the previous article on Power BI (which also uses Power Query), we both highly recommend that if you do choose to stay mostly in Excel, please oh please try Power Query, it will change your life!
7. Other features
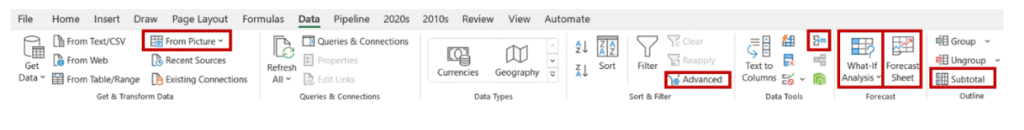
Google’s text wrap has an option to clip text, unavailable in Excel, and a brand new eyedropper tool to pick up a colour from another aspect of your screen. Google’s custom number formats are more intuitive to use and it can also sort a range in a range order with Data > Randomize range. Excel’s Data tab has advanced filtering capabilities, and built-in tools to subtotal, forecast, consolidate, and convert pictures of tables into data. What If Analysis including Data tables, and goal seek which are often used by financial modellers do not exist in Google Sheets at the time of writing.
Excel also has better auditing tools, such as Review > Workbook statistics or “Go to special” (under Home > Find and select) to select all cells which meet a specific criterion, Excel’s Formulas tab also has the watch window, error checking, trace dependents and precedents (that I personally rarely use). Both apps have the “Show formulas” view. Google Sheets is lacking most of Excel’s Draw tab capabilities, whilst its theming and print options allow for the most useful capabilities, even though Excel has more capabilities. From my experience, a landscape sheet one page wide with repeated headers on each page covers most print needs, it’s easy within Google (repeated header rows on print follows frozen panes) but in Excel, there are too many options so most are unaware of the optimal aspects to change. Below is a video of printing tips on Excel.

Whilst both can convert an image URL to an image in a cell (after Excel’s recent release of the IMAGE function), Google can insert your images in cells, as well as translation through the DETECTLANGUAGE and GOOGLETRANSLATE functions. Google Sheets has recently introduced Smart Chips when you press @ anywhere, you can refer to a calendar event, a contact, a file, and public data such as a date (e.g., tomorrow), a location, or a stock and then converting to a smart chip will give more information on hover. The somewhat equivalent in Excel is Data > Linked Data Types which work for stocks, currencies, and geography, but can’t refer to your data unless it’s created through complex operations in Power BI or Power Query.
8. Collaboration
I’ll bet you were waiting for this one to be a big differentiator however Excel Desktop has now added almost all of the collaboration functionality that Google has, with simultaneous editing, the ability to track history on a cell-by-cell basis, assign tasks via comments, share a link to a range of cells, filter for yourself only via Sheet View but Google Sheets seems to crash less often and have fewer issues with merging changes across workbooks. One great tool in Google is Notifications so the user is emailed immediately or via a digest when edits have been made to a worksheet, this and other collab tools are shown here. Both can autosave on the cloud and files can be renamed or moved without leaving the app, but again Google’s process is smoother.
Excel offers additional accessibility features including the Navigation pane on the View tab, as well as Review > Check accessibility which opens a new Accessibility tab offering new features which could benefit all users.
9. Compatibility
Google has paid close attention to making Excel convert well to Google Sheets. This is best achieved via Google’s File > Import which even converts VBA script into Google’s App Script. Even without converting, a .xlsx or .xlsm file saved on Google Drive can be edited on Google sheets with changes being reflected when the file is later reopened in Excel, which also means that Google Sheets can reference a cell range from an Excel file updated live. An xlsb file format simply won’t import. It’s not available in the dropdown selection when you want to open a new file, which explains it. Google Sheets can be exported as a .xlsx file but if the “Alternating formats” feature is used it is converted to an Excel “Table” in theory but sometimes this process fails. Certain formulas can also break upon conversion in both directions but breaks happen more from Google to Excel than from Excel to Google.
Every single human gets the same version of Google Sheets which gets updated regularly but the same cannot be said about Excel Desktop. There is a constant battle working with users or IT departments who don’t access or release new versions or functionality of Excel. This becomes an issue when working with those outside an organisation and results in an Excel file being unusable by someone with an older version. The most common issues can come from using dynamic arrays, Lambdas along with similar formulas and function updates. The cost savings of a free Excel desktop version is often to blame, and although Excel Online fixes some issues, it is nowhere near on par with Google Sheets or Excel Desktop at the time of writing.
As Google Sheets’ scripting language is more modern, Google has far more options for Add-Ins and integrating with other applications than Excel. With business intelligence, Excel is closely linked to Microsoft’s market-leading Power BI whilst Google’s Looker Studio (previously Data Studio), is far less capable. Both have mobile applications with various features and slightly different user interfaces but I personally find myself using Google for quick data entry more frequently than Excel because of aspects like date pickers and checkboxes.
10. Performance
Google Sheets can be edited offline by installing a Chrome extension (but you must be using Google Chrome or Microsoft Edge), more information can be found here. Google Sheets can now hold up to 10M cells, which is lower than Excel’s limits (17 billion but has 1M row and 16k column limits per sheet). Google struggles before Excel does with large datasets (20k+ rows), particularly where aspects like Conditional Formatting and Data validation are heavily used but for 99.9% of spreadsheet needs this limitation will not be noticeable. Choose your spreadsheet tool wisely so you are not left with a spinning wheel or error messages. Speaking of performance, if you are still unsure check out this Google vs Excel battle, this was an incredible performance by two MVPs (David for Google Sheets and Alan Murray for Excel) and hosted/moderated by Danielle Stein Fairhurst and a few months later, David was fighting Excel’s corner in a similar battle against Ian Pay in an ICAEW webinar.
If you had to teach this topic in a class to school kids what key tips would you give them to focus on
There is no doubt that in today’s world spreadsheeting skills are vital no matter which one you choose. If skills learned in school were proportional to life skills, spreadsheets would be taught far more in schools.
What practical steps and links can people take now to learn more
David has kindly shared several links and embedded videos above. The best place and time to start is now. Many think of advanced formulas being the key to spreadsheets, but spreadsheets can do much without writing any formulas, go through your tabs and menus, and have a look at buttons you never click on because many of those can save you hours.
How important is this skill in the context of learning Financial Modelling?
Nobody can dispute the fact that to be a half-decent financial modeller you have to be a reasonably skilled spreadsheeter. The vast majority of financial modellers use Excel exclusively, however, many have started to explore some of the cool features that Google has to offer. Excel does many things better than Google, but Google also does many other things better than Excel, the best financial modeller chooses the best tool for each scenario and in many cases, the better tool is Google Sheets.
How do all this disruption, AI and automation talk impact this topic
Both spreadsheet products already have AI incorporated into them in a few ways:
- Google’s Explore and Excel’s Analyze data can run algorithms through your data and show you trends as well as answers you type in via tables or charts (e.g. total sales for 2022 compared to 2023).
- Google’s Smart fill can write a formula and fill down a column based on a user typing in a few entries whereas Excel has an equivalent Formula/column by examples, but for now, it’s only available in either Power Query or Excel Online.
Google’s more flexible Apps Script language allows for better integration with third-party automation tools (including AI), and whilst Excel has recently launched Office Scripts using Typescript, its functionality is still limited. These integrations will undoubtedly become more important over time, but even though processes may change, it seems clear that spreadsheets will not go away anytime soon.
Conclusion
Each tool has its benefits, Google Sheets offers strong in-grid solutions through more functions, better validation, images, checkboxes, and smart chips inside cells, whilst Excel’s structured tables provide a significant acceleration in calculation speed and formula benefits plus its game-changing Power Query has redefined the entire way, we go about spreadsheeting. In any case, financial modellers and spreadsheet users who exclusively use one over the other are definitely missing out on some great flexibility and functionality.
If you want to find out more and follow the rest of the article series be sure to download the Financial Modelling App and if you want to find more information on financial modelling and content visit the Model Citizn website.