
Knowledge sharing made easy for lifelong learners using Power BI Embedded
At Model Citizn, we’re committed to empowering businesses and individuals with cutting-edge tools to transform data into actionable insights and Power BI embedded.
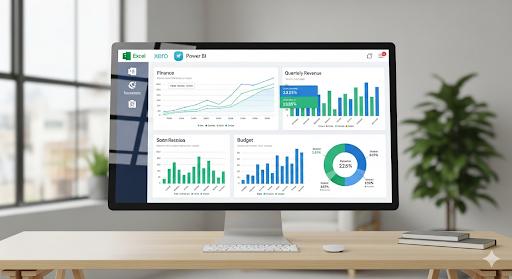
One of the exciting features now available on our Knowledge Hub is the ability to embed interactive Power BI reports directly into our platform.
This innovation allows you to explore financial models, dashboards, and analytics in real-time, all from the comfort of our newly enhanced and improved website.
Interactive Learning: Mastering “What-if” Analysis with Power BI
Understanding how different variables can impact your business outcomes is a critical skill in finance. This interactive Power BI report is designed to help you master “what-if” analysis, a powerful technique used for financial forecasting and strategic planning. By manipulating a few key assumptions, you can see the immediate effect on your financial results, allowing you to prepare for various scenarios and make more informed decisions.
This embedded tool is structured to guide you through two levels of what-if analysis, from simple single-variable changes to more complex, multi-variable scenarios.
Explore the What-If Scenarios

The report’s homepage provides a clear starting point with two options.
The Simple What-ifs section focuses on a single variable to show how one change can have a direct impact. You’ll see a visualization of a monthly income forecast and a slider that allows you to adjust a single variable, such as “Income Flex.” As you move the slider, you can see how the projected total income changes for each month, providing a clear and immediate visual of the cause-and-effect relationship.
The Complex What-ifs section takes this a step further by introducing multiple, interconnected variables. This is where you can see how adjustments to both income and margin simultaneously affect key financial metrics. This view includes a dashboard showing Current and Scenario data for metrics like Gross Margin, Total Income, and Direct Costs. With multiple sliders, you can test more realistic, multi-faceted scenarios that are common in business planning.
By exploring both the simple and complex what-if scenarios, you’ll gain a deeper appreciation for the power of data analysis in financial modeling.
Learn and Interact with Power BI Embedded for Free
The best part?
You can access and interact with these embedded Power BI reports for free on our Knowledge Hub.
Here’s how you can get started:
Explore the Collection: Visit the Knowledge Hub and navigate to the Blogs section to find articles accompanied by embedded Power BI dashboards. These include tools like the 3-way Financial Model with Power BI and the Simple Property Valuation Model, designed to help you practice and learn.
Hands-On Learning: Click through the interactive elements to adjust variables, view different scenarios, and see how data shifts in real-time. This hands-on experience is ideal for both beginners and advanced users, aligning with our tailored Power BI training programs.
Free Resources: Alongside the embeds, we offer downloadable Excel models and guides to complement your learning. From financial forecasting to budgeting tools, these resources are crafted to boost your career prospects and decision-making skills. You can find these in our Shop.
As we look back on the excitement of 2024 and move forward into 2025 and beyond, our goal remains to transfer expert coding knowledge to those with a basic awareness, empowering you to build your own tools. The embedded Power BI reports are a stepping stone to mastering these skills, available at no cost.
Join the Journey
We’re continually updating the Knowledge Hub with new content and interactive features.
Whether you’re inspired by the latest trends in financial modelling or eager to learn from our comprehensive programs, there’s something for everyone.
Start exploring today in the Knowledge Hub and unlock your potential with Model Citizn’s free, interactive learning tools.
Below you will find the first of many to be embedded soon to be released.
Model Citizn is a digitally savvy company that enables better decision-making and value creation using technology and bespoke models, dashboards and business intelligence.
We help simplify complexity by helping you make relevant, informed and purposeful decisions with insight.
Model Citizn is an Australian-based company that has been providing financial modelling and data analytics services and training since 2016.
We support clients in many different countries and industries that are looking to gain more value from the accounting and finance function
Model Citizn uses some of latest cutting-edge technologies to provide comprehensive outsourced CFO services.
We have built cash flow, valuation and business performance models including scenarios.
To find out more follow us on social media